Michael Schmid
|
Dec 5, 2019
|4 min read min read

A traffic-based light display for DrupalCon Amsterdam!
We’ve been thinking for a while about what we could do to visually present part of our infrastructure. Working in the digital world, it can be hard to imagine the scope of what we do. Most data is displayed on a screen but it’s cool when we can bring things more into the physical world and connect with people. A few years ago, we had the idea to make a real hosting cluster on Rasberry Pis as a way for event attendees to see our failover redundancies work in real-time.
We wanted to do something different, and with the opportunity to have a large group of our amazee.io engineers in one place, we stocked up on supplies and brought it all to BADCamp with the goal of getting them ready to show the community at DrupalCon Amsterdam 2019.
We knew we wanted to create a visual way to show the traffic on our servers using a light display. We had a brainstorming session and bought 33 feet of addressable LED strips and a Rasberry Pi to organize all of it.
Our Parts list
Signal amplifier (not strictly needed, but makes sure the data signal is strong enough)
LED Strip Channels (not strictly needed, but protects the LEDs)
4 Pin JST SM Connector (always good to have additional cables)
These kinds of strips allow you to program each light on the strip individually, and so have a lot of flexibility. But along with this flexibility comes complexity. We had to figure out what we wanted to display and how to make it look great in a way that would be easy to understand.
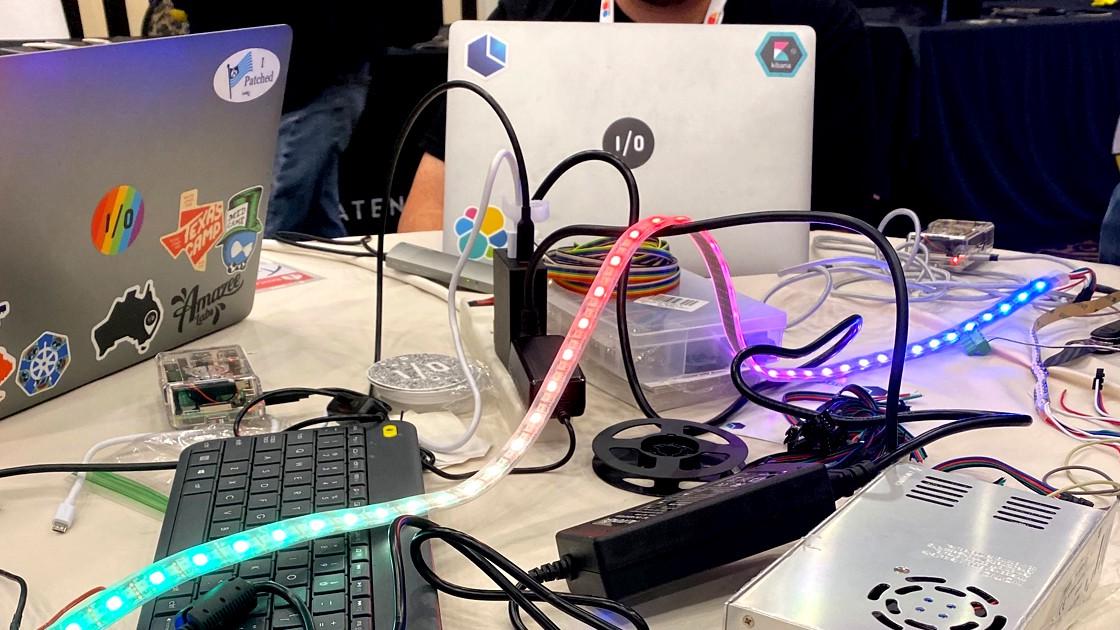
Two of our team members, Ben Jackson and Tyler Ward, had played with these kinds of strips before, and Chris Davis did some work on programming the lights ahead of time, in order to make simple patterns, etc. So when we sat together at BADCamp we already were able to get up to speed on the basics and were ready to decide what data we could represent and how to make it look awesome.
Over three days, between BADCamp sessions, we tackled two sides of the project simultaneously:
The Data
As we store every log entry, every hit to the websites we host, on an Elasticsearch cluster, we could easily set up a request to get all the information from the last 10 seconds. We connected the Rasberry Pi to Elasticsearch in order to process this data and then we needed a way to represent it on the lights. While we had one team working on getting the data and parsing it, we got another team working out the best way to display it
The Display
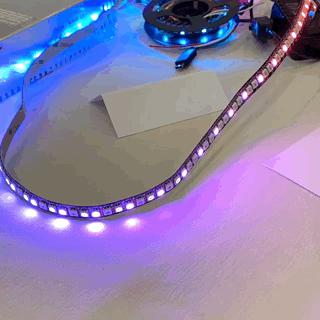
We wanted the lights to look cool, like shooting stars tracking across the container we had organized for our booth at DrupalCon Amsterdam. Using some sample data we figured out that addressing each light individually, meant that to move a light along the strip, we would need to update each one about 60 times a second for it to look good.
Having a large amount of data visually represented meant that the LED strips were crowded with lights, and we lost the cool traveling effect. We figured out how to give each light a tail of slightly dimmer lights in order to help them look like they are moving across the strip.
At this point, we knew how to get the look we’d like, and the other team had figured out how to pull the hosting data. All of it. Which turned out to be a little too much for one Rasberry Pi to handle. From here we had two options: either to slow down the lights or use less data to reduce the CPU usage.
We knew the stips looked best when they had 10–15 hits traveling at a time, so we decided to reduce the amount of data. Instead of using all the traffic from all of our sites on one of our clusters. We selected some sites that generated about 3 to 4 hits per second, but still, when traffic spiked we could experience lag or overcrowding, so we programmed a filter to keep it in the zone.
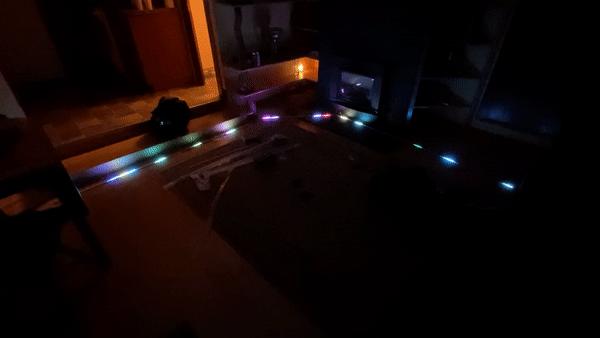
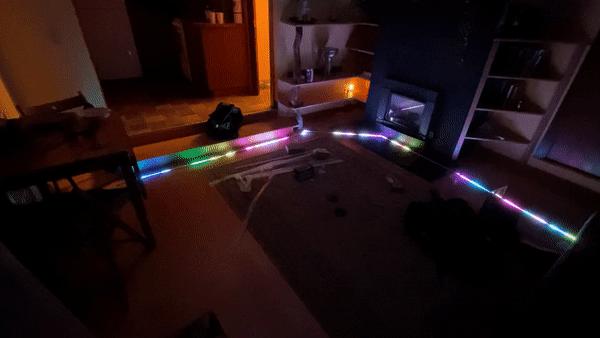
Because we could customize both the color and the speed of each of our light trails, we knew we could represent different kinds of hits in different ways. We also figured out that it was relatively simple to have these light trails overtake each other, so we could visually represent that larger files would move slower across the strip than smaller ones. When you look at the light display in this video, the fast lights moving quickly represent smaller files like CSS or JS files. If you see a slower moving light trail, it represents something bigger like a pdf file.
We looked at ready-built solutions but ended up building this custom code version on our own. As a team-building exercise, it was a great experience. As a fully distributed team, we often collaborate by handing things off from one team (and timezone) to another. Sitting together IRL meant we got to experience problem-solving and collaboration in real-time, and that we could work in team configurations that are usually prevented by location.
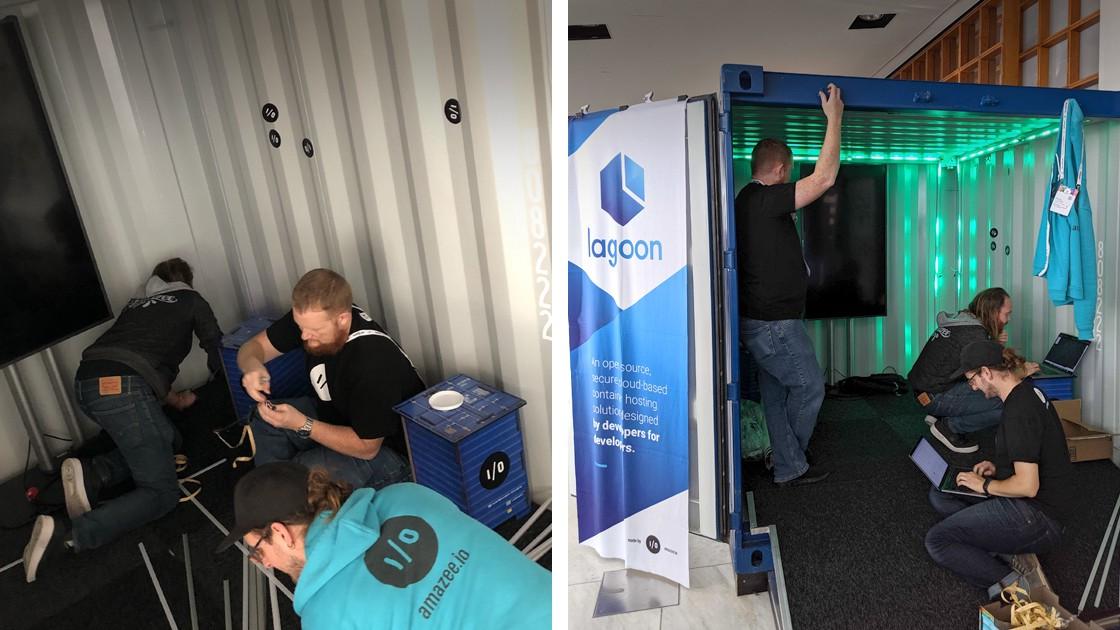
We also got to have the fun of creating this publically in the common area at BADCamp where members of the community could stop by and see what we were up to, ask questions, and offer suggestions.
Most of the finished code is in Python, which was a new area for some of us and can be found on Github in case it’s useful for anyone else. It was fun to get to display this at DrupalCon Amsterdam inside our awesome container booth.
The Drupal community knows us and knew that the lights were probably more than just a neat decoration. We got to have a lot of great conversations about how they worked. As for how cool it looked, check out our video from DrupalCon Amsterdam for yourself and let us know what you think!